App Discovery
The App Discovery feature is designed to help locate all web-based applications that are frequently used by users in an organization, but its AppNavi application has not been created at the tenant level. Once the App Discovery application is discovered, the user can create an AppNavi application for it.
Enable App Discovery
In order to run app discovery, the user has to enable app discovery on the tenant level from "Manage Tenant".
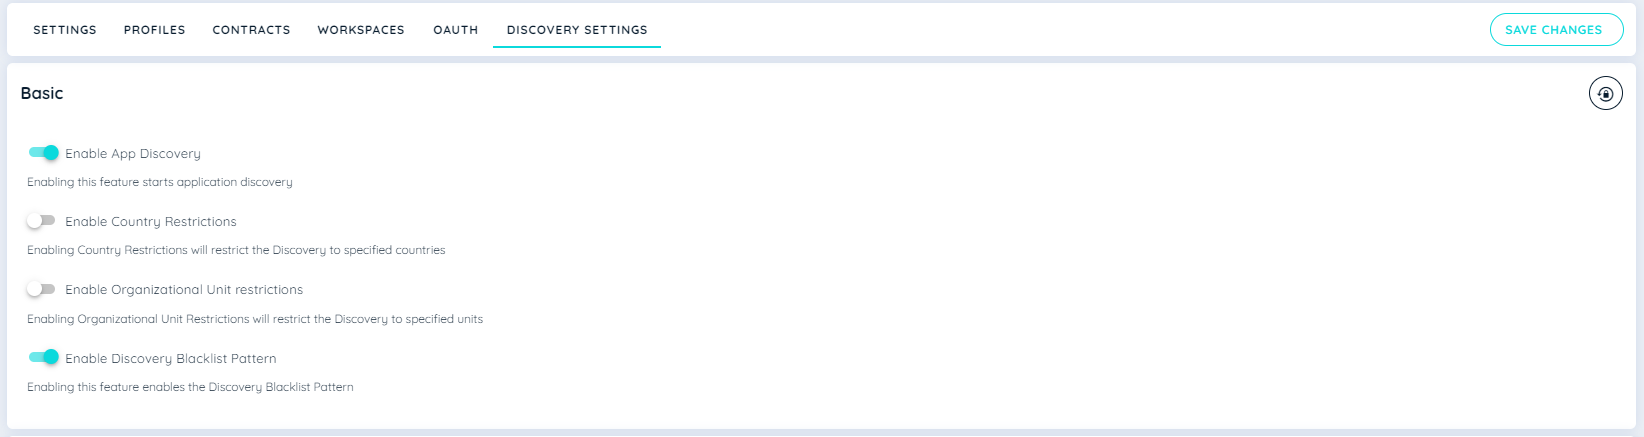
Enable App Discovery Screen
App Discovery Blacklist Patterns
Users have the ability to blacklist specific patterns or URLs, which prevents any applications matching these patterns or URLs from being discovered in the future on client side and applications are also removed from discovery analytics.
Once the Discovery Blacklist Pattern button is enabled, the App Discovery Blacklist Patterns table will appear. Here user can perform the following functions:
- Add Pattern: Click the + Icon, a dialect will open where user fills the title, pattern and active status.
- Edit Pattern: Here user can edit the above details if require any changes.
- Deactivate Pattern: User can deactivate the pattern, once deactivate discovery application will perform normally and will not be the part of blacklist mechanism.
- Delete Pattern: User can delete pattern from the table
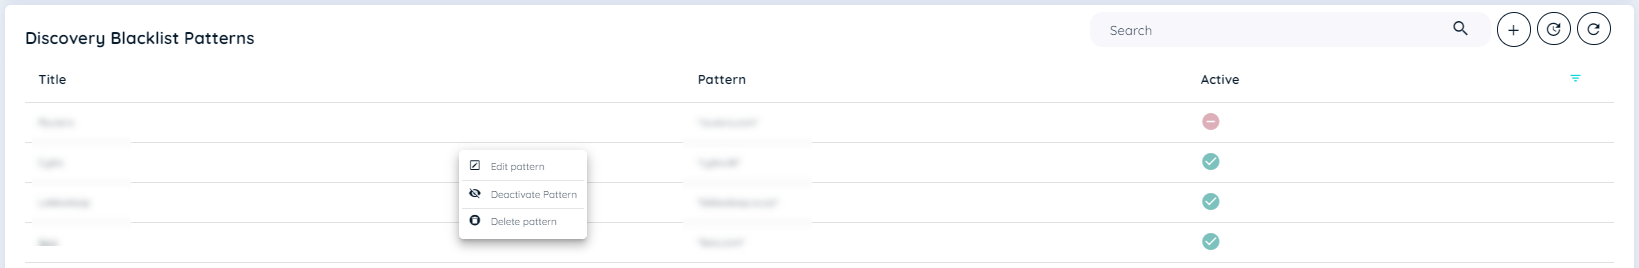
Blacklist Pattern Table
Update Blacklist
There is Update Blacklist Icon adjacent to + Icon as well, this will update a complete JSON file of blacklist pattern in the table.

How Does App Discovery Work
App Discovery aims to provide insights into user engagement and interaction with each web application. It tracks activity time, which includes scrolling, page interactions, and user engagement. It does not record any user inputs, it just checks for user interaction with the page and record its time. When a user first goes to any web application and App Discovery is enabled and the app is not blacklisted, the extension generates a data for that application if it has not any in the local storage. The data contains information related to App Discovery event like the activity time, userId and appUrl. This data will be used in the App Discovery event which will be sent only once in 24 hours. Only the main website would be considered for App Discovery and interaction in IFRAME won't be considered for activity time
Events will include the following information collected by the extension
| Property | Description |
|---|---|
| browser | Refers to the browser on which the application is discovered (Chrome, Edge) |
| browserLanguage | Refers to the browser language (en-US, de) |
| countryCode | Refers to the country from which the event has been recorded based on time zone |
| integrationMode | Type of integration mode ( “extension“ by default ) |
| pageUrl | Application URL on which the the event was generated, or you can say the discovered app. https://www.google.de https://www.google.de/search https://www.google.de/search?query=23123123 Note only the base URL or origin will be captured. in this case ( https://www.google.de ). All of these are one and the same app. |
| userId | Refers to the global user id. If there is none, the extension will create one and send it |
| sessionId | Refers to the session of the user based on tabs |
| unixTimestamp | Refers to when the event was generated |
| activityTime | Refers to the activity time of the user in a discovered app |
App Discovery Functionalities
To access Discovered App Analytics and its functionalities, please navigate to "Analytics -> Discovery" from the portal.
Following is the functionality of App Discovery.
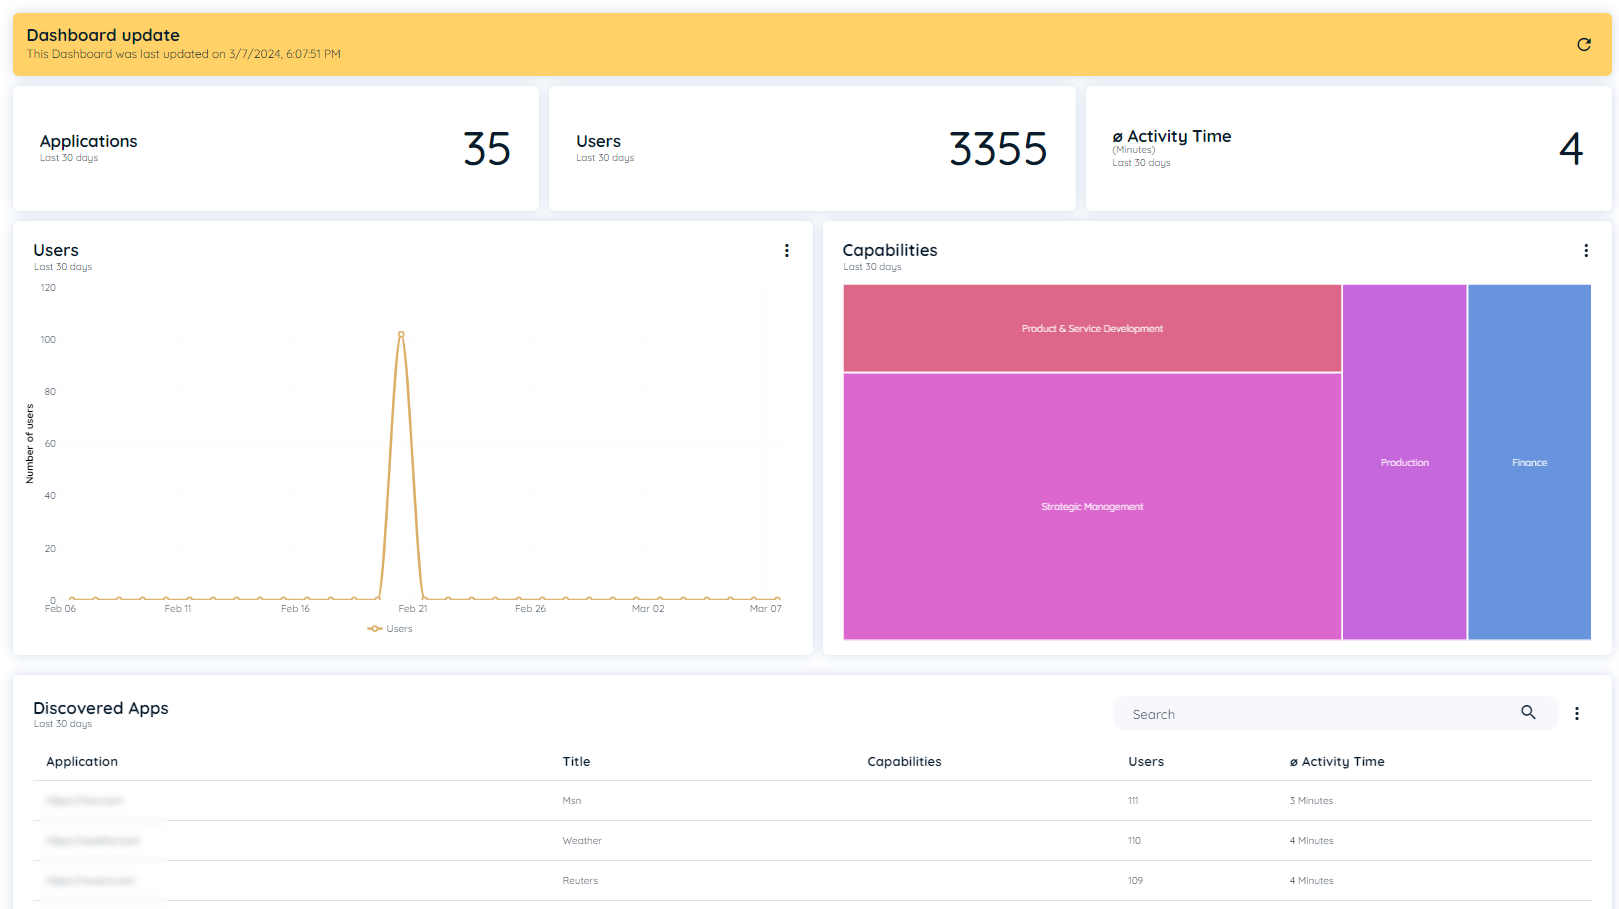
Discovered Apps
This tile shows the number of Discovered Apps by users over All-time. A single discovered app contains 25 unique user data set.
Countries
This tile shows the number of Countries by All-time that have 25 or more unique user data set
Users
This tile shows the count of total users who have visited in the last 30 days.

Discovered Apps, Countries, & Users
Daily User Activity
The chart depicts the average time users allocate to each capability. The average duration is computed based on a fixed 9-hour workday. This implies that dedicating 9 hours during their work hours would represent complete utilization, equivalent to 100% of the allocated time.
It will show data for the Last 30 days and All-time.
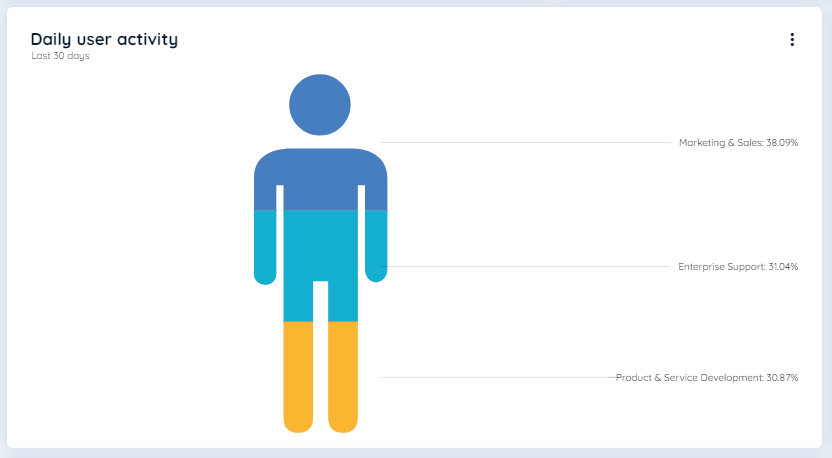
Daily User Activity
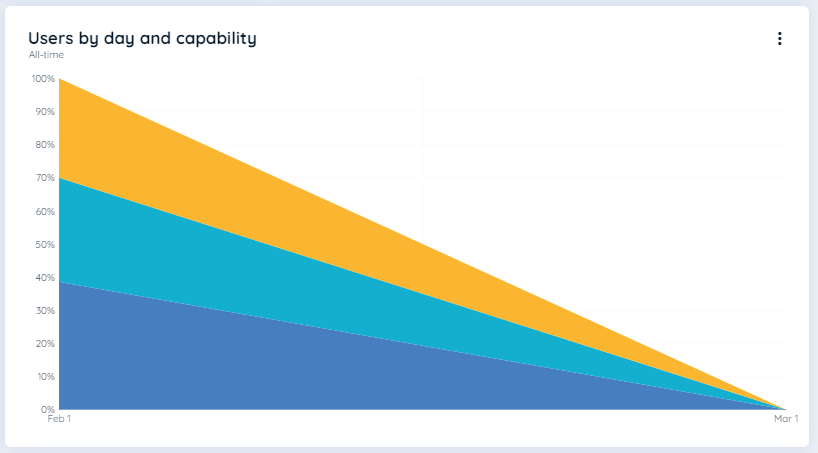
Users by day and capability
The chart depicts the percentage of users used each capability on a daily basis, it also show the avg time for each capability.
It will show data for the Last 30 days and All-time.
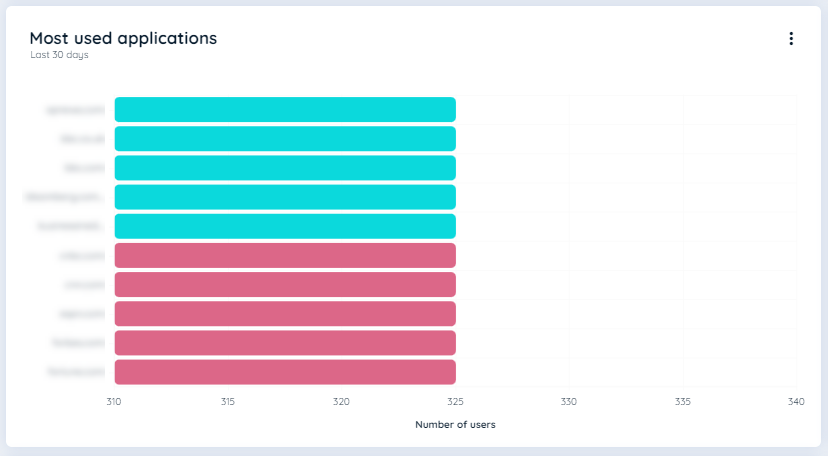
Most Used Applications
This Bar chart displays the top 5 and bottom 5 applications based on the number of users, showcasing the applications with the highest user count.
It will show data for the Last 30 days and All-time.
To access Detail App Analytics and its functionalities, users can click on an application from the most used application chart or from the Analytics option present in the context menu of the discovered application tab.
The top title will show the URL of the selected application.
The analytics data on this page will not be fetched through nightly jobs, as this time push load of 1000s of application in nightly job. Instead user can fetch data on a particular app through the refresh Icon present on each application analytics page. This will fetch the analytics data of a specific app at a time.
Following is the information:
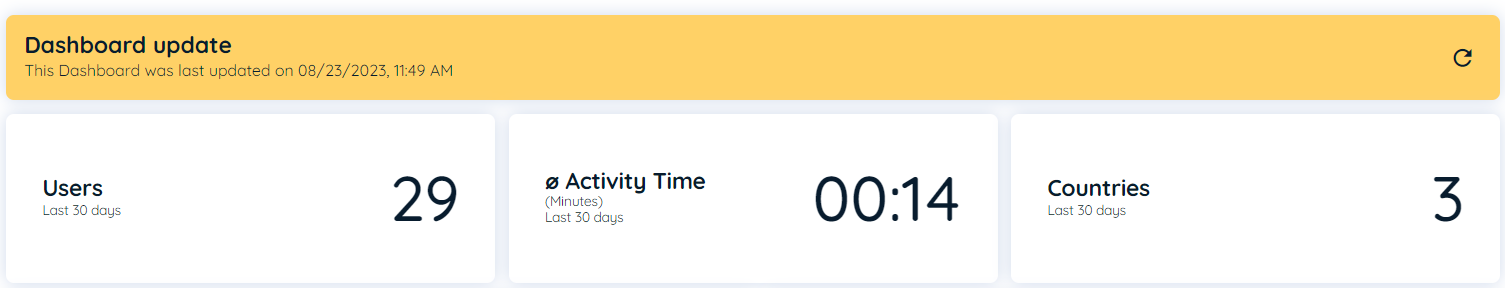
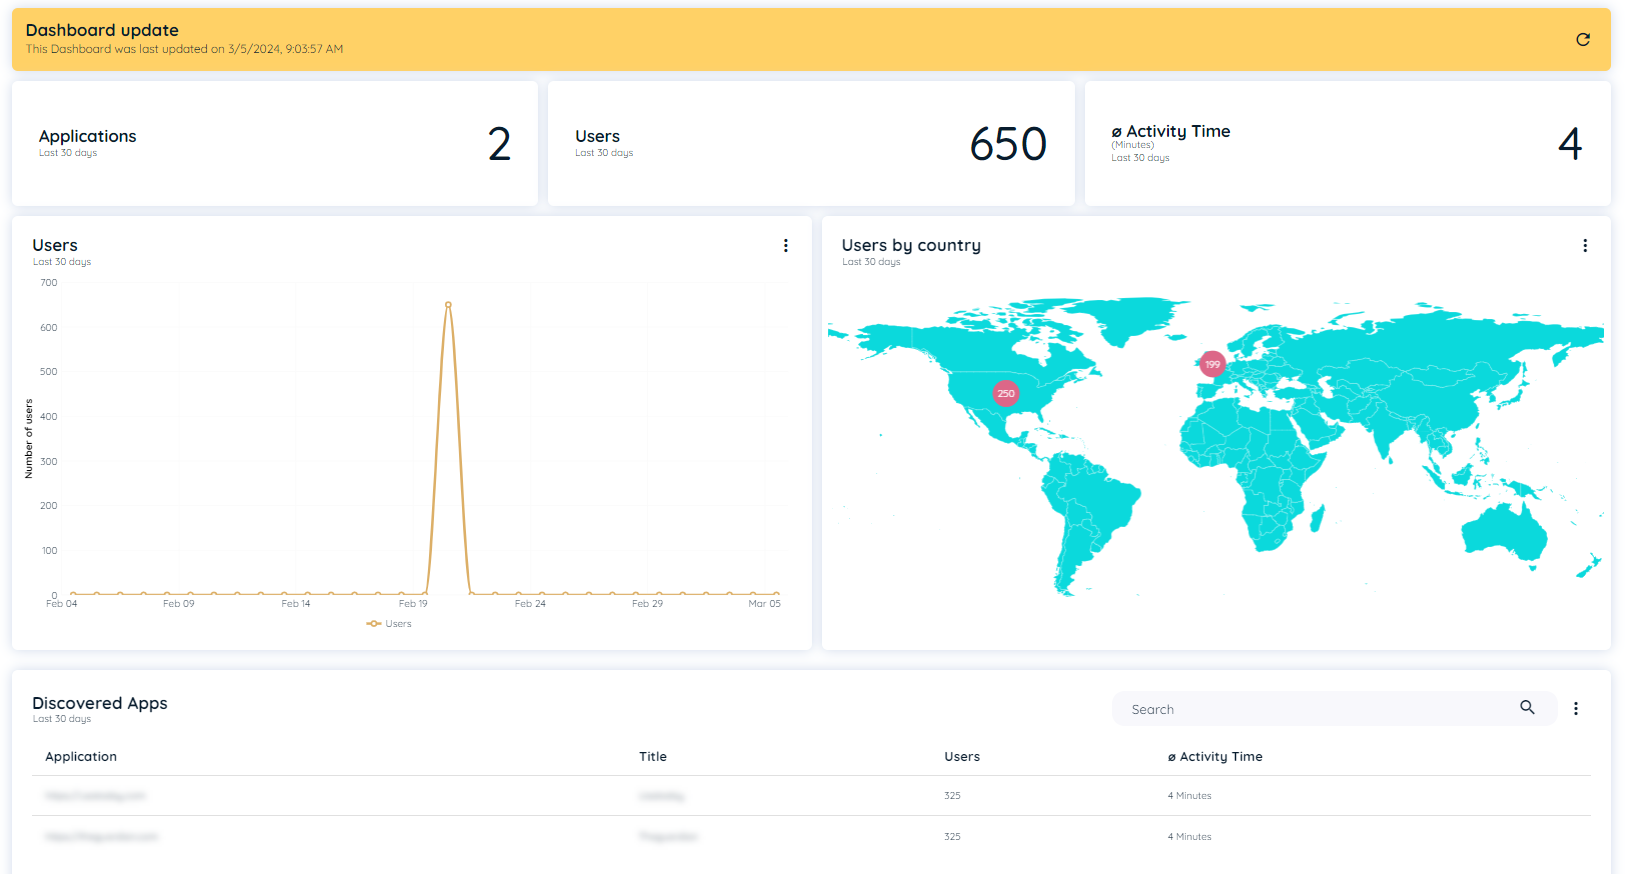
Users
This shows the count of users in the past 30 days that were discovered within the application.
Avg. Activity Time
The activity time is calculated from the records of the last 30 days, where we sum the total activity time and then divide by the total users to calculate the average. The time durations are displayed in minute’s format, for example, "3:20," indicating 3 minutes and 20 seconds.
Users by Country
The count of countries from which users have come in the last 30 days for that specific application.
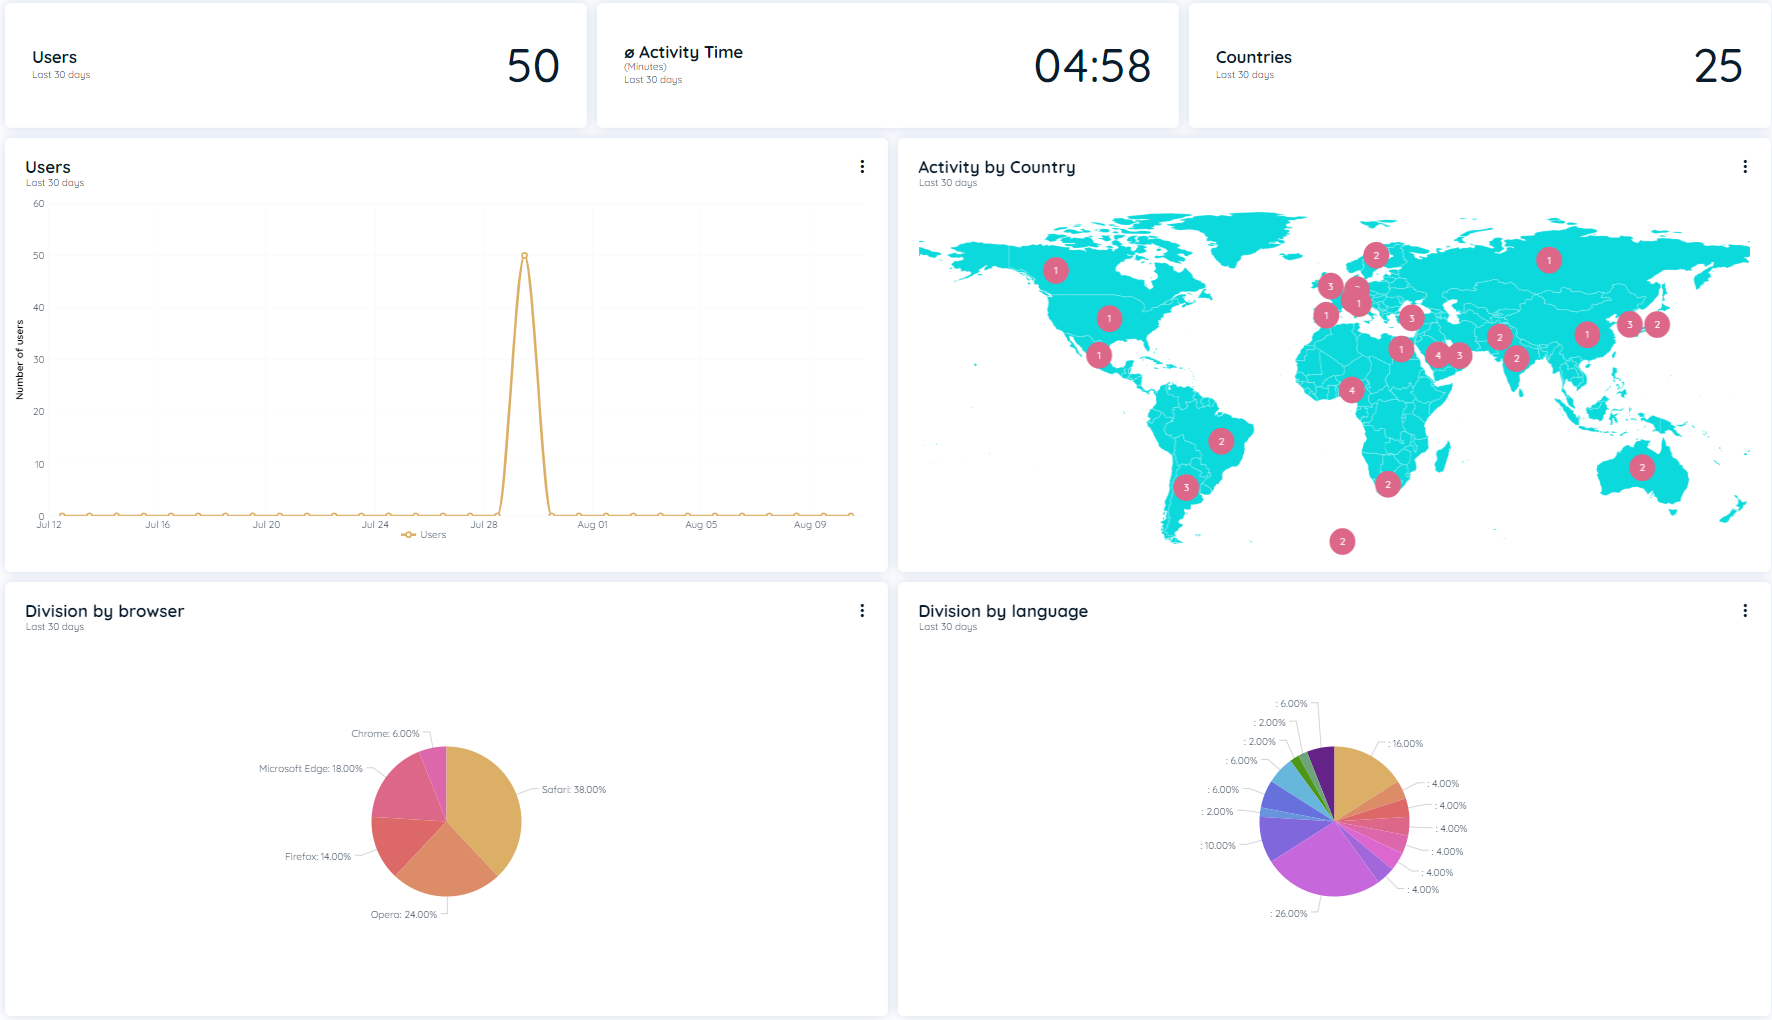
User Chart
The line chart displays the number of users who have arrived on each date.
It will show data for the Last 30 days and All-time.
Countries
A country chart that displays the origin or source countries of the users from where they have visited.
It will show data for the Last 30 days and All-time.
Language
A pie chart depicting the distribution of languages based on the number of users.
It will show data for the Last 30 days and All-time.
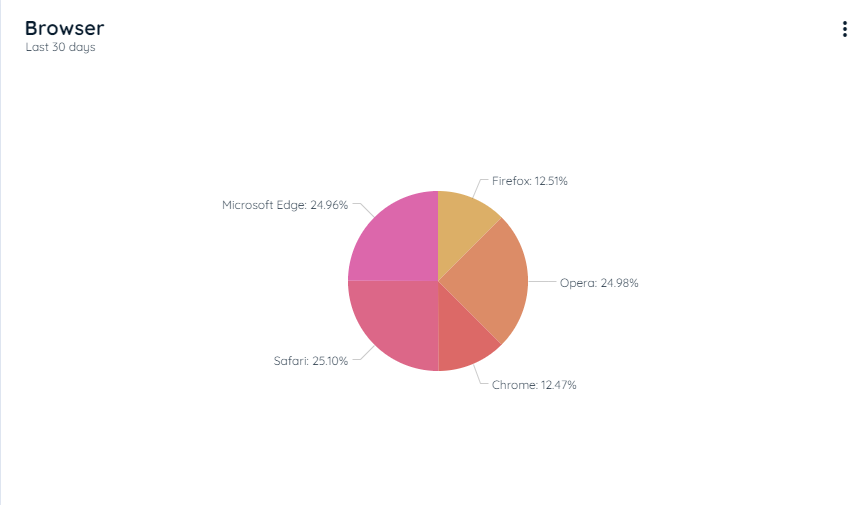
Browser
A pie chart depicting the distribution of browsers based on the number of users.
It will show data for the Last 30 days and All-time.
Detail Analytics of Most used Applications
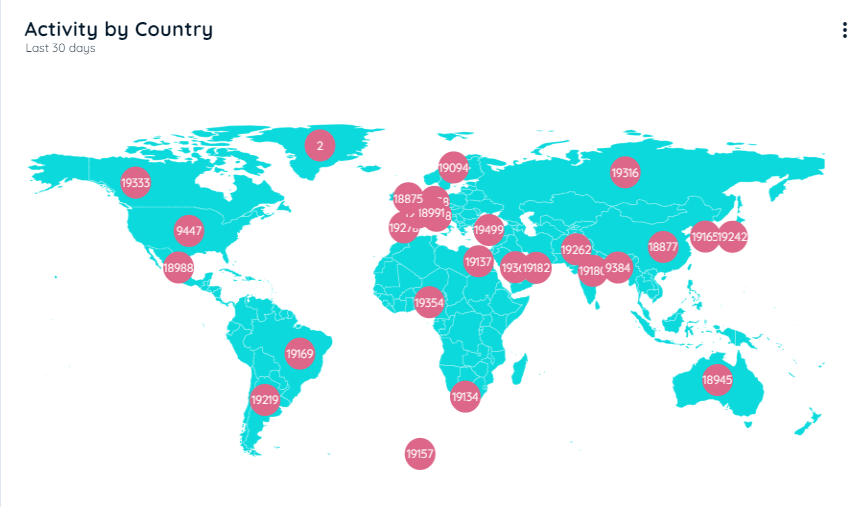
Users by Country
An insightful country chart illustrating the source countries of users and their corresponding visitation frequency. The chart highlights countries with 25 or more distinct users.
It will show data for the Last 30 days and All-time.
If the user clicks on any country, a new analytics page will open for that specific country. Following are the chart details that are mentioned in this analytics:
Applications: Total number of applications that belong to a specific country.
Users: Total number of users that belong to a specific country.
Activity Time: Average activity time users spend in that country.
User Chart: It tells the total number of users date-wise.
Capabilities Show all the capabilities that are accessed by this specific country. It further shows the total number of users.
Discovery App Table: This table shows data of Application, Title, Capabilities, User, and Activity Time.
Users by Country Chart
Capabilities
An insightful country chart illustrating the source capabilities of users and their corresponding visitation frequency. The chart highlights countries with 25 or more distinct users.
It will show data for the Last 30 days and All-time.
If the user clicks on any capability, a new analytics page will open for that specific capability. Following are the chart details that are mentioned in this analytics:
Applications: Total number of applications that belong to a specific capability.
Users: Total number of users that belong to a specific capability.
Activity Time: Average activity time users spend in that capability.
User Chart: It tells the total number of users date-wise.
User by Country Show all the countries that are accessed by this specific capability. It further shows the total number of users.
Discovery App Table: This table shows data of Application, Title, User, and Activity Time.
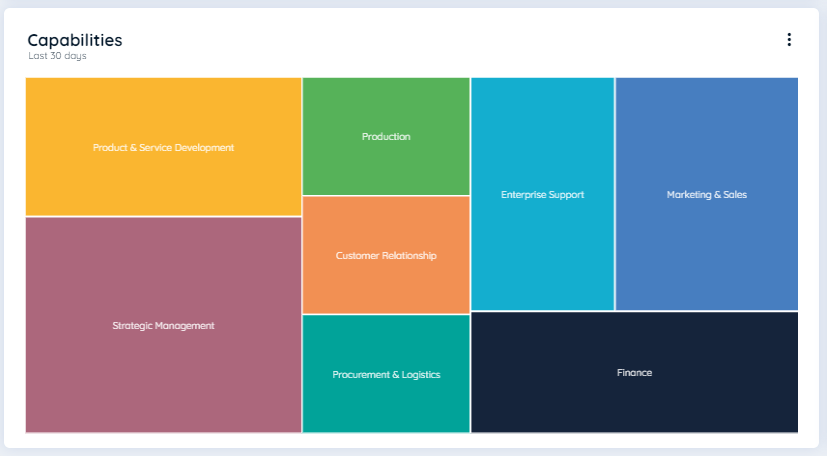
Capabilities Chart
Browser
This is a pie chart that shows the distribution of browsers based on the number of users.
Browsers that have 25 or more users will be displayed in the chart.
It will show data for the Last 30 days and All-time.
Discovered Apps
This is a table that lists all the discovered apps that have 25 or more users. This table encompasses comprehensive data related to a discovered app, including its title, capability, type, user, activity time, and intensity score. Additionally, users can filter data that they wish to display in the table. The table contains the following columns:
Application: It shows the URL of the application.
Title:It shows the title of the Application, which is edited by the user.
Capability:It will show the capability assigned to the application based on the URL.
Users: It will show the total number of users in that specific application.
Type: It display the type of an application. There are 4 types with some set of rules.
- SaaS: All applications that are from business capability belong to this SaaS type.
- Standard Software: All application that have www. and more than 2 dots, having no www.
- Others: Application that don't belong to SaaS or Standard Software are part of "other"
- Customer Built: User set this, its not automatically set by the system.
Activity Time: It allows to track the usage time of discovered app over the last 30 days.
Intensity Score: It is a calculated metric that combines two crucial aspects: the average usage time in seconds and the relative engagement of users within the Application compared to the total user count within the Tenant.
Managed: This is the status, which shows the application is assigned to the AppNavi application.
Capability Filter: A drop down is available in the capability list to narrow down the search according to any capability mapped to a discovered application in the table. Users can also search for the capability in the filter drop down.
Context Menu Options
Analytics
This option will open detailed analytics for a selected application.
Open App
This option will open the selected URL in a new tab.
Edit App
This option will open an edit dialog from which users can add a title for that application and also change the capability for the selected application.
Here, users can also search for and map selected applications to existing AppNavi applications from the search tab.
Create AppNavi App
The user can create an AppNavi app for existing discovery apps; once the AppNavi app is created for the discovery app, the option to create an AppNavi app will not be visible, and the user cannot create more than one AppNavi app. Follow the given steps to create the AppNavi app.
- Select "Create AppNavi App"
- Workspace Dialect will appear if there is more than one workspace
- Select Workspace and click "Create"
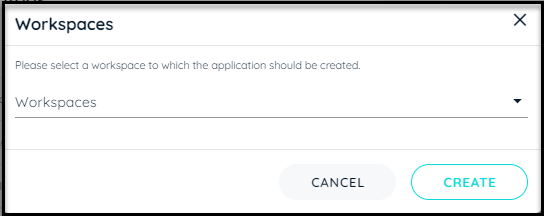
Workspaces Screen
- The Edit application page will open to fill in the data. The Title and capability will be prefilled and English will be default language.
- Fill in all other required fields and save the changes.
Discovery App Table
This table encompasses comprehensive data related to a discovered app, including its title, capability, type, user, activity time, and intensity score. Additionally, users can filter data that they wish to display in the table.
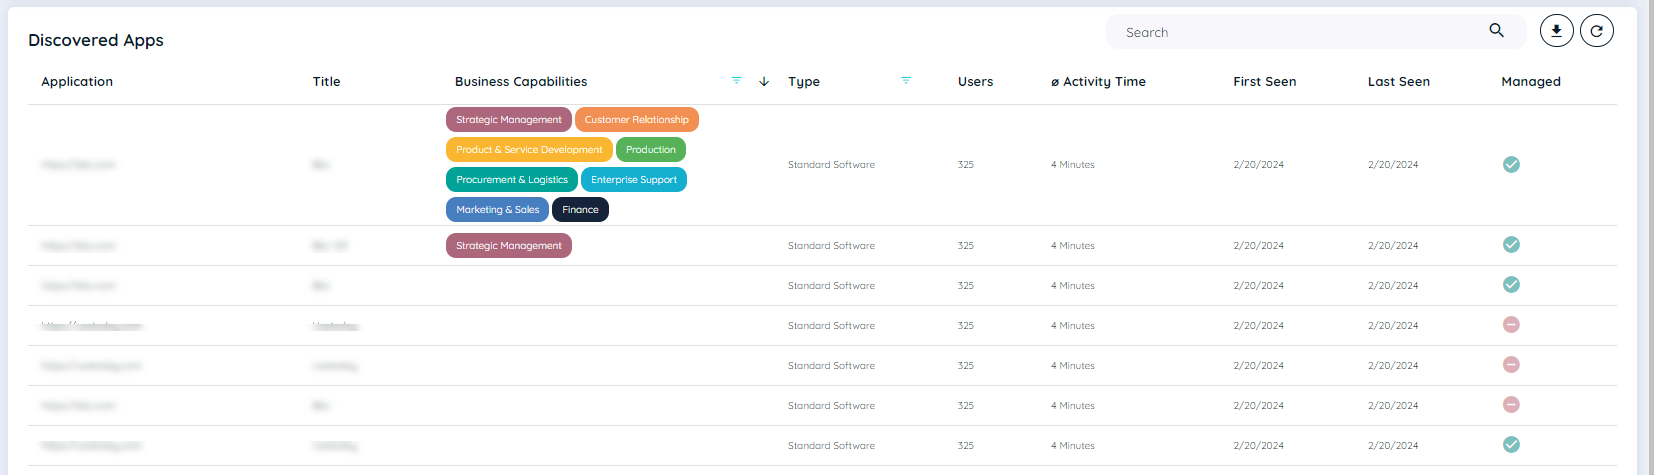
Discovered Apps Screen
Updated 24 days ago